

- cross-posted to:
- [email protected]
- cross-posted to:
- [email protected]
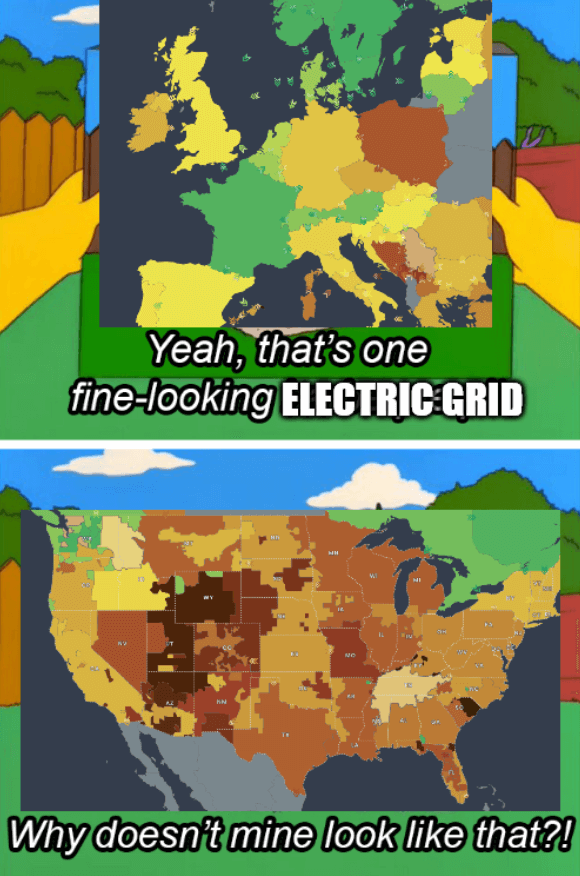
Source - The colors of the grids represent CO2 emissions
The title is a reference to the 2021 Texas power crisis
Source - The colors of the grids represent CO2 emissions
The title is a reference to the 2021 Texas power crisis
The part about the texas crisis made me think it’s about why the USA is not a single grid, while Europe is one.
Iirc one big reason made the crisis that severe was their grid is separate, so they couldn’t buy electricity from other states.
Also if that’s the case than using screenshots from that webside is quite misleading. That site uses live data, so if the 2 screenshots were taken at the same time, one of the continents was at night, so solar panels were not working… An avarege or aggregate map should be used, not live data
There was video on Practical Engieneering about this. They could and did until power line protection tripped.